






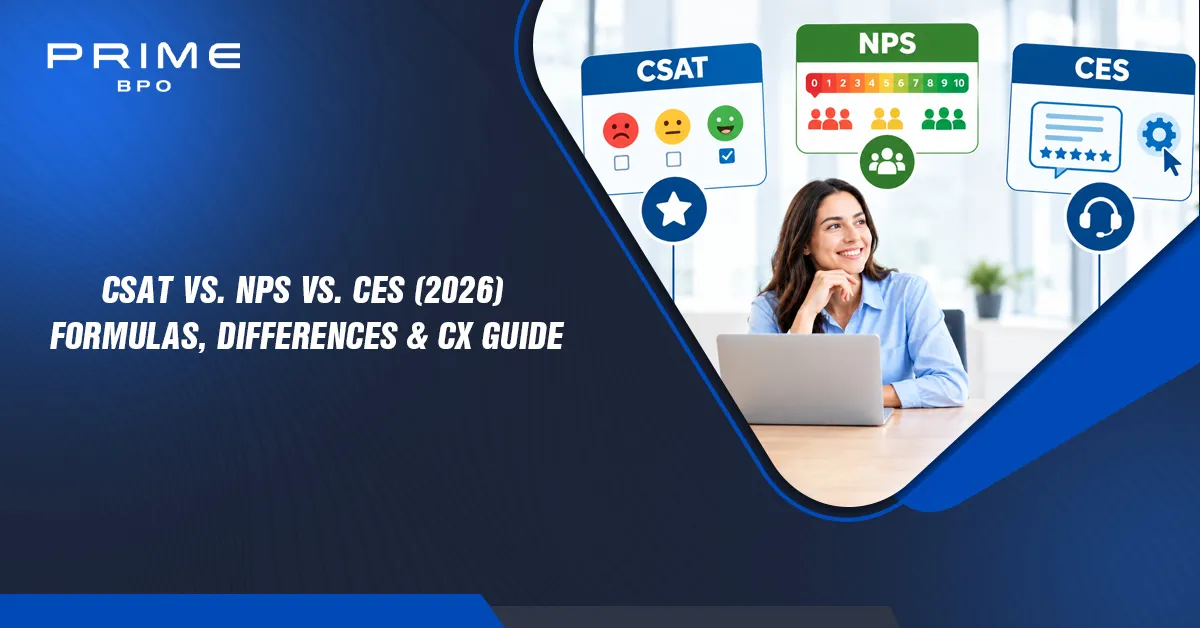



































CSAT, NPS, and CES are the three most widely used customer experience metrics. They are often reported side by side as if they measure the same thing, but they don't. CSAT tells you whether one interaction went well. NPS tells you whether customers would recommend your brand. CES tells you how hard you made it for them to get something done.
Quick answer: CSAT measures satisfaction with a specific interaction (percent of 4–5 ratings on a 5-point scale). NPS measures loyalty and willingness to recommend (percent promoters minus percent detractors, from −100 to +100). CES measures how easy it was to resolve an issue (average rating, often on a 1–7 scale). Use CSAT after interactions, NPS for the overall relationship, and CES for processes and self-service.
What is the difference between CSAT, NPS, and CES?
The difference is what each metric measures and when. CSAT is a transactional metric about a single interaction, NPS is a relational metric about the whole brand relationship, and CES is a process metric about friction. Together they cover the short-term, long-term, and operational sides of customer experience.
- Customer Satisfaction Score (CSAT): "How satisfied were you with your experience today?" It captures how a customer feels right after a specific interaction, such as a support call or a delivery.
- Net Promoter Score (NPS): "How likely are you to recommend us to a friend or colleague?" It measures customer loyalty and advocacy toward the brand overall.
- Customer Effort Score (CES): "The company made it easy for me to handle my issue." It measures how much effort the customer had to spend to get a problem solved or a task done.
The CX metric triangle
|
Level |
Metric |
Question it answers |
Time horizon |
|
Transactional |
CSAT |
Did this interaction meet expectations? |
Immediate |
|
Relational |
NPS |
Will this customer stay and recommend us? |
Long term |
|
Process |
CES |
How much friction is in our processes? |
Ongoing, by journey step |
Prime BPO has separate guides on what a Net Promoter Score is and what a customer satisfaction score is; this guide compares all three.

Get Free Quotes
Customized Options Await
Core differences: CSAT vs. NPS vs. CES
CSAT, NPS, and CES differ in focus, question, scale, and what they predict. CSAT is best for judging service quality interaction by interaction; NPS is best for tracking long-term loyalty and growth; CES is best for finding the friction that drives repeat contacts and churn.
Focus, questions, scales, and output
- CSAT usually uses a 1–5 scale (sometimes 1–3, 1–10, or emoji) and reports a percentage from 0% to 100%.
- NPS always uses a 0–10 scale and reports a score from −100 to +100.
- CES commonly uses a 1–7 agreement scale (strongly disagree to strongly agree) and reports an average, though some teams use 1–5 or report the percentage who agree.
Predictive power
Each metric predicts something different:
- CSAT reflects short-term quality. A drop flags a problem with an agent, script, or process right away, but satisfied customers can still leave.
- NPS reflects long-term loyalty. Bain & Company, which created NPS, reports that companies leading their industries on NPS grow at more than twice the rate of competitors on average.
- CES reflects churn risk tied to friction. Research by Matthew Dixon and colleagues, published in Harvard Business Review in 2010 and based on more than 75,000 customers, found that customer effort predicted loyalty better than satisfaction or NPS. Gartner reports that 96% of customers with a high-effort service interaction become more disloyal, compared with 9% of those with a low-effort experience.
Master comparison: CSAT vs. NPS vs. CES
|
Factor |
CSAT |
NPS |
CES |
|
Focus |
Satisfaction with one interaction |
Loyalty and advocacy |
Effort and friction |
|
Survey question |
"How satisfied were you with…?" |
"How likely are you to recommend us…?" |
"The company made it easy for me to handle my issue." |
|
Scale |
1–5 (most common) |
0–10 |
1–7 agreement (most common) |
|
Formula |
% of 4–5 responses |
% promoters − % detractors |
Average of all ratings |
|
Output range |
0%–100% |
−100 to +100 |
1–7 (higher = easier) |
|
Timing |
Right after an interaction |
Periodically (quarterly, annually, at renewal) |
After a task, process, or self-service attempt |
|
Primary owner |
Support / contact center leaders |
CX, executive team, account management |
CX, product, digital, operations |
|
Retention impact |
Indirect, short term |
Strong link to growth and referrals |
Strong link to disloyalty and churn |
See also Prime BPO's guide to call center metrics.
Formulas: how to calculate CSAT, DSAT, NPS, and CES
CSAT and DSAT are percentages of positive or negative responses. NPS subtracts the percentage of detractors from the percentage of promoters. CES is usually a simple average of effort ratings. Each one takes a minute to calculate once you have the survey data.
CSAT calculation (and DSAT)
CSAT (%) = (Number of positive responses [4 and 5] ÷ Total survey responses) × 100
DSAT (%) = (Number of dissatisfied responses [1 and 2] ÷ Total survey responses) × 100
Example: 500 customers answer a 1–5 survey: 330 give a 5, 70 give a 4, 40 give a 3, 35 give a 2, and 25 give a 1.
- CSAT = (330 + 70) ÷ 500 × 100 = 80%
- DSAT = (35 + 25) ÷ 500 × 100 = 12%
- The remaining 8% are neutral (3s).
NPS calculation
NPS = % Promoters (9–10) − % Detractors (0–6)
Passives (7–8) count in the total but aren't added or subtracted.
Example: 1,000 responses: 550 promoters (55%), 250 passives (25%), 200 detractors (20%).
- NPS = 55 − 20 = +35
CES calculation
CES = Sum of all individual effort ratings ÷ Total number of responses
Example: On a 1–7 scale (7 = strongly agree it was easy), 200 responses add up to 1,160 points.
- CES = 1,160 ÷ 200 = 5.8
Some teams instead report CES as the percentage who agree (5, 6, or 7). Use one method consistently.
Note: Always state the scale and calculation method when you report a score. An 80% CSAT on a 1–5 scale isn't comparable to an 80% on a 1–10 scale.

Benchmarks: what is a good score?
There's no single benchmark that applies to every company, because survey design, channel, and customer mix change the results. Useful reference points:
|
Metric |
Reference point |
Source / note |
|
ACSI customer satisfaction (0–100 index) |
Banks 80; credit unions 78; financial advisors 82; online investment platforms 79 |
ACSI Finance Study 2026 |
|
ACSI customer satisfaction (0–100 index) |
Wireless service 77; internet service providers 73 (fiber 76, non-fiber 71) |
ACSI Telecommunications Study 2026 |
|
NPS |
Above 0 means more promoters than detractors; many teams treat +30 and up as strong and +50 and up as excellent |
Common rule of thumb; compare with your own industry |
|
CSAT |
Many support teams target 80%+ |
Rule of thumb; varies by channel and survey design |
|
CES |
Track your own baseline and trend by journey step |
No widely accepted cross-industry benchmark |
Note: ACSI scores are a national 0–100 index built from its own survey model, not a CSAT percentage. Use them to compare industries, not as a direct target for your CSAT survey. The most useful benchmark is usually your own trend over time.
Get Free Quotes
Customized Options Await
Deep dive: CSAT (Customer Satisfaction Score)
CSAT is the most common customer service metric because it's simple and immediate. Ask customers to rate a specific interaction right after it happens, and you get fast feedback on agents, channels, and processes. Its weakness is that it says little about long-term loyalty on its own.
When to measure CSAT in customer service
- After a support call, chat, or email is resolved
- After an order is delivered or an installation is finished
- After onboarding or a training session
- After a specific feature or product interaction
Send the survey within minutes or hours, while the experience is fresh. Keep it to one rating question plus one optional open comment.
CSAT vs. DSAT: isolating negative friction
CSAT shows the share of happy customers; DSAT (dissatisfaction score) shows the share of unhappy ones. Tracking both matters because two teams can have the same CSAT but very different DSAT. For example, 80% CSAT with 5% DSAT means most of the rest are neutral, while 80% CSAT with 18% DSAT means a large group is actively unhappy.
In contact centers, DSAT is especially useful for quality assurance (QA):
- Review every DSAT response and tag the root cause (agent behavior, policy, product defect, wait time, or a repeat contact).
- Separate agent-controllable causes from process or product causes, so agents aren't penalized for things they can't fix.
- Feed agent-controllable DSAT into coaching and QA scorecards.
Prime BPO's guides to call center quality assurance best practices and improving the QA process cover this in more detail.

Pros and cons of CSAT in contact center operations
|
Pros |
Cons |
|
Easy to understand and explain |
Measures a moment, not the relationship |
|
Fast, interaction-level feedback |
Response bias: very happy and very unhappy customers answer most |
|
Links directly to agents and channels |
Scales and wording vary, so comparisons are hard |
|
Good for coaching and QA |
Can be gamed if agents ask for high scores |
Deep dive: NPS (Net Promoter Score)
NPS measures how likely customers are to recommend your company, which makes it a proxy for customer loyalty and future growth. It's best used as a regular pulse on the overall relationship, not as a score for a single interaction.
What NPS measures
NPS sorts customers into three groups based on the 0–10 question "How likely are you to recommend us to a friend or colleague?":
|
Group |
Score |
What it means |
|
Promoters |
9–10 |
Loyal customers who recommend you and are more likely to stay and buy more |
|
Passives |
7–8 |
Satisfied for now but open to competitors |
|
Detractors |
0–6 |
Unhappy customers who may churn and spread negative word of mouth |
According to Bain & Company's Net Promoter System, promoters account for more than 80% of referrals in most businesses, and passives' repurchase and referral rates can be up to 50% lower than promoters'.
Transactional NPS vs. relational NPS
- Relational NPS (rNPS) is sent on a regular schedule, such as quarterly, annually, or before a contract renewal, to measure the overall relationship.
- Transactional NPS (tNPS) is sent after a specific interaction, such as a support case, to see how that touchpoint affected loyalty.
NPS in customer service is often transactional, but a single support call rarely changes how someone feels about the whole brand. Many teams use CSAT for individual interactions and keep NPS relational.
How NPS relates to customer lifetime value and growth
Promoters tend to stay longer, buy more, and refer others, all of which raise customer lifetime value (LTV). Bain reports that its NPS leaders grow at more than twice the rate of competitors on average. To use NPS well:
- Segment results by customer type, product, region, and account size.
- Close the loop: follow up with detractors quickly, and ask promoters for reviews or referrals.
- Link NPS to renewal, expansion, and churn data in your CRM to see which scores actually predict revenue.
Deep dive: CES (Customer Effort Score)
CES measures how easy it was for a customer to get an issue resolved or a task done. Because high effort is strongly linked to disloyalty, CES is one of the best tools for finding and fixing the friction that causes repeat contacts and churn.
Why effort drives churn
The 2010 Harvard Business Review study "Stop Trying to Delight Your Customers" found that going above and beyond made little difference to loyalty. What mattered most was a simple, quick resolution. Gartner reports that 96% of customers with high-effort service interactions become more disloyal, versus 9% with low-effort interactions. Common sources of effort include:
- Having to contact the company more than once for the same issue
- Being transferred or asked to repeat information
- Switching channels (for example, from chat to phone) to get help
- Confusing self-service, forms, or policies
Measuring effort in AI self-service, portals, and L1/L2 support
|
Touchpoint |
When to ask CES |
What to look for |
|
AI chatbot or virtual agent |
When the conversation ends or hands off |
Low scores on handoffs; repeated questions |
|
Help center or customer portal |
After an article view or task completion |
Tasks that people abandon or call about |
|
L1 support |
After the case closes |
Transfers, repeat contacts, long holds |
|
L2/L3 escalations |
After resolution |
Long time to resolution, repeated explanations |
|
Onboarding |
After setup steps |
Steps where customers get stuck |
Pair CES with operational data like first-contact resolution, transfer rate, and repeat-contact rate to find the root cause. See Prime BPO's guide to customer self-service.
Customer effort score vs. CSAT
CSAT asks how customers feel about an interaction; CES asks how hard it was. A customer can be satisfied with a friendly agent but still frustrated that it took three calls. Using both shows whether low satisfaction comes from the people (CSAT drops while effort stays low) or the process (CES drops too).
Get Free Quotes
Customized Options Await
When to use CSAT vs. NPS vs. CES across the customer journey
Use CSAT right after support interactions, NPS on a regular schedule or around renewals to measure the relationship, and CES after self-service, onboarding, or any process you want to simplify. Most mature CX programs use all three, each at the touchpoint it measures best.
Metric deployment map
|
Journey stage |
Best metric |
Why |
|
Onboarding / setup |
CES |
Finds steps where new customers get stuck |
|
Self-service (help center, chatbot, portal) |
CES |
Measures whether customers could finish without help |
|
Post-support interaction (call, chat, email) |
CSAT (+ DSAT) |
Rates the agent and the resolution |
|
Purchase or delivery |
CSAT |
Rates a specific transaction |
|
Quarterly or annual relationship pulse |
NPS (relational) |
Tracks loyalty and advocacy over time |
|
Contract renewal (B2B) |
NPS |
Flags at-risk accounts before renewal |
|
After a complaint or escalation |
CES + CSAT |
Shows both effort and satisfaction with the fix |
A simple decision guide
- Want to know if a specific interaction went well? Use CSAT.
- Want to know if a process is too hard? Use CES.
- Want to know if customers will stay and recommend you? Use NPS.
- Want to coach agents? Use CSAT and DSAT, plus QA scores.
- Want to predict churn? Combine NPS (relationship) with CES (friction).
Building a unified 3-metric CX scorecard
|
Metric |
Level |
Target direction |
Review cadence |
Owner |
|
CSAT |
Interaction |
Up |
Daily / weekly |
Contact center leadership |
|
DSAT |
Interaction |
Down |
Weekly, with root-cause review |
QA team |
|
CES |
Process |
Up (easier) |
Monthly, by journey step |
CX / operations / product |
|
NPS |
Relationship |
Up |
Quarterly |
Executive team / CX |
|
First-contact resolution |
Operational driver |
Up |
Weekly |
Contact center leadership |
Note: Keep surveys short and don't ask the same customer every metric at once. Survey fatigue lowers response rates and skews results.
For a broader view, see Prime BPO's customer experience strategy and customer experience management guides.

Conclusion:
CSAT, NPS, and CES aren't competitors. CSAT shows how each interaction lands, NPS shows whether the relationship is healthy, and CES shows where your processes make customers work too hard. Used together, with clear formulas and consistent timing, they give leaders a complete view of customer experience.
|
Your goal |
Metric to prioritize |
|
Improve agent quality and coaching |
CSAT and DSAT |
|
Reduce repeat contacts and friction |
CES |
|
Track loyalty and growth |
NPS (relational) |
|
Improve self-service and digital channels |
CES |
|
Reduce churn in B2B accounts |
NPS + CES |
|
Report CX to the board |
NPS trend + CSAT + CES scorecard |
Scale customer operations with Prime BPO
Prime BPO runs offshore contact center operations from Pakistan for U.S. and international clients, with customer contact operations certified to ISO 18295-1:2017. Prime BPO contact center solutions include customer service, technical support, inbound call center services, and call quality assurance, services that support ongoing tracking of CSAT, DSAT, and resolution quality.
Schedule a CX audit at Prime BPO or call +92-51-8733177 to review your contact center KPIs.
Frequently asked questions
What are the 5 key CX metrics?
There's no official list, but five commonly tracked customer experience metrics are Customer Satisfaction Score (CSAT), Net Promoter Score (NPS), Customer Effort Score (CES), first-contact resolution (FCR), and customer churn or retention rate. Contact centers often add average handle time and response time as operational metrics.
Which is better, NPS or CSAT?
Neither is better overall; they answer different questions. CSAT is better for judging individual interactions and coaching agents. NPS is better for tracking long-term loyalty and growth. Most organizations use CSAT for transactions and NPS for the overall relationship.
What are the four types of customer satisfaction?
There's no single standard list. One common way to group customer satisfaction measurement is: transactional satisfaction (one interaction, measured by CSAT), relational satisfaction or loyalty (the whole relationship, measured by NPS), effort (how easy it was, measured by CES), and product satisfaction (how well the product meets needs, often measured through product-specific surveys).
What is NPS and is it a KPI?
NPS (Net Promoter Score) measures how likely customers are to recommend a company on a 0–10 scale, calculated as percent promoters minus percent detractors. Many companies use NPS as a key performance indicator (KPI) for customer loyalty, often reported to executives quarterly.
What is the difference between CSAT and NPS?
CSAT measures satisfaction with a specific interaction on a short scale and reports a percentage. NPS measures willingness to recommend the brand on a 0–10 scale and reports a score from −100 to +100. CSAT is short-term and transactional; NPS is long-term and relational.
What is CSAT vs. DSAT?
CSAT is the percentage of customers who were satisfied (usually 4 or 5 on a 1–5 scale). DSAT is the percentage who were dissatisfied (usually 1 or 2). Tracking DSAT separately helps contact centers find and fix the causes of negative experiences.
Sources And 2026 Verification
Note: All sources opened October 20, 2026. Worked examples use illustrative numbers. NPS and CSAT targets in the benchmark table are common rules of thumb, not industry averages.
Sources
- Bain & Company Net Promoter System: Measuring your Net Promoter Score
- Harvard Business Review: Stop Trying to Delight Your Customers (Dixon, Freeman & Toman, July 2010)
- Gartner: The Effortless Experience
- Salesforce: Customer service metrics (cites Gartner 96% vs. 9% effort statistic)
- ACSI Finance Study 2026: Business Wire, Feb. 24, 2026
- ACSI Telecommunications Study 2026: ISE Magazine / ACSI Release, May 2026
- Prime BPO: Contact us (ISO 18295-1:2017 certification)