





Most BPO leaders find out an account is leaving during the exit call. By then, nothing can be done. The warning signs were sitting in the data three months earlier.
That is the real cost of skipping churn rate analysis. It is not a reporting exercise. It is the difference between renewing a contract and scrambling to replace the revenue.
What Does It Actually Involve?
This is the process of learning how many customers are clients you use over a set time period and then breaking that down to find out why they left and who is likely to leave next.
This will combine three things and these are churn rate calculation, a look at which customer segments churn faster and forward looking model that will flag the accounts showing early warning behavior. If it done right it will turn a lagging metrics into the working alarm system.
The basic formula is simple. Divide the number of customers lost during a period by the number of customers you had at the start of that period, then multiply by 100.
A firm that starts the quarter with 400 clients and loses 20 has a 5% quarterly churn rate. The math is easy. The insight is in what happens next.

Customer Churn Analysis: Where Most Teams Get It Wrong
The mistake is treating churn as one number. A blended churn rate hides the segments actually bleeding revenue.
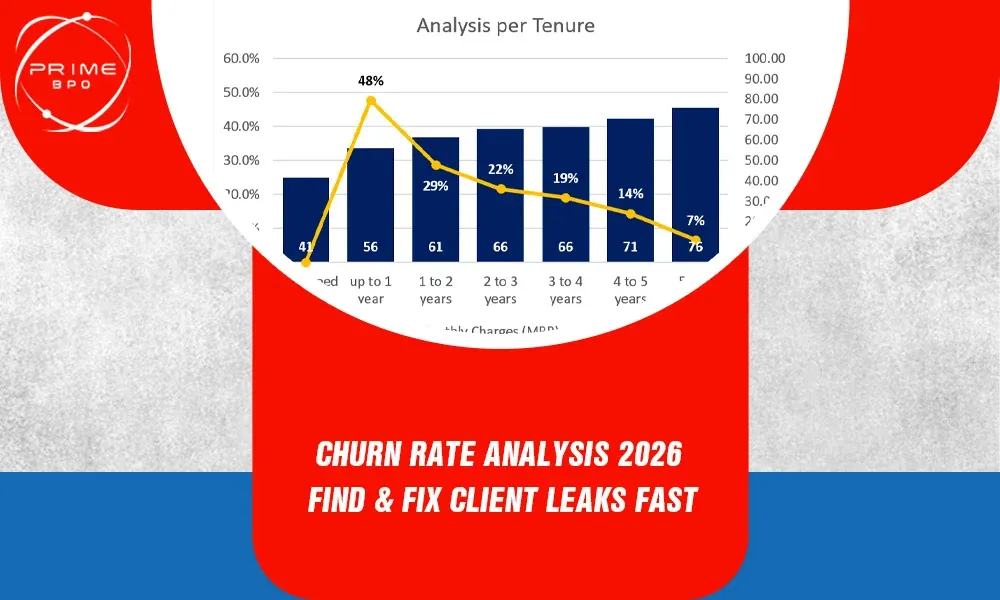
Split the analysis by the contract size, tenure, industry, and service line before drawing any conclusions. A 3% blended churn rate will still mean one segment is losing clients at 12% a year while another holds steady near zero.
According to Recurly's 2026 churn benchmark data, a healthy annual churn rate typically sits between 3% and 5% across most subscription verticals, with B2B accounts clustering at the lower end. Anything meaningfully above that band, in a specific segment, is your signal to dig in.
Churn Rate Cohort Analysis: Track Groups, Not Just Totals
Cohort analysis groups clients by the month or quarter they signed, then tracks how each group's retention curve moves over time. It answers a question a single churn number cannot: is retention getting better or worse for new business compared to older accounts?
If clients onboarded in the last two quarters are churning faster than clients from two years ago, the problem is likely in onboarding, not in service delivery. That distinction changes where you spend your fixed budget.
Run cohort analysis monthly, not annually. A once-a-year check catches problems long after the damage compounds across several cohorts.

Get Free Quotes
Customized Options Await
Churn Rate Predictive Analysis: Catching the Signal Before the Exit
The predictive churn analysis will score active accounts on their likelihood to leave, using the behavior patterns rather than waiting for the cancellation notice. The common inputs include ticket volume spikes, declining usage, slower response to check-in and repeated escalation to the same issue.
A basic model does not require a data science team. Start with the three or four variables that you already try, weigh them and then flag any account crossing a threshold for the manual review.
More mature setups use survival analysis, a statistical method borrowed from medical research, to estimate how long a typical client relationship lasts and which factors shorten it. It is the same math used to model equipment failure timelines, applied to customer lifecycles instead.

Churn Rate in BPO: Why the Number Runs Differently Here
BPO churn behaves differently from SaaS churn because two things are being measured at once: client accounts leaving the vendor, and agents leaving the floor. The two are connected more tightly than most operators admit.
As explained in this breakdown of call center attrition in BPO, agent attrition functions as an early indicator of risk to client accounts, since multi-client demands and offshore dynamics make turnover harder to manage than in an in-house center. When agent turnover rises on an account, service consistency drops first, and client churn follows a few months later.
Per Call Force Global's 2026 attrition benchmarks, far-offshore voice floors run 45% to 60% annual attrition, while US onshore centers run 30% to 45%. Centers holding attrition under 15% see roughly 26% higher CSAT scores, which is the metric clients actually feel before they decide to renew or walk.
Call Center Churn Rate vs. Client Churn Rate
|
Metric |
What It Measures |
Typical 2026 Range |
Leading Indicator Of |
|
Agent attrition rate |
Staff leaving the floor |
30% to 45% onshore; 45% to 60% far-offshore |
Service quality drops |
|
Client churn rate |
Accounts leaving the BPO |
3% to 8% annually, contract-dependent |
Revenue loss |
|
First-year agent attrition |
New hires leaving within 12 months |
69% to 73% |
Onboarding and training gaps |
|
Sub-15% attrition centers |
Best-in-class staffing stability |
Under 15% |
Roughly 26% higher CSAT |




































Customer Retention in BPO: What Actually Moves the Number
Retention in BPO comes down to three levers: staffing stability, response speed on service issues, and how early problems get escalated to the client relationship team, not the account manager finding out after the fact.
Based on Insignia Resources' 2026 turnover research, replacing a single agent costs $10,000 to $20,000 in direct expenses, and the total impact, including lost productivity, can reach $46,000 per agent. That cost gets passed to service quality long before it shows up on an invoice, which is exactly what a client notices first.
Best Churn Rate Visualization Tools for Retention Analysis
A churn model is only useful if the people who can act on it actually look at it. Dashboards need to show risk at the account level, not buried in a company-wide average.
|
Tool Type |
Best For |
Strength |
Limitation |
|
BI dashboards (Power BI, Tableau) |
Cohort and segment views |
Custom visualizations, drill-down by account |
Requires clean data pipeline |
|
CRM-native reporting (HubSpot, Salesforce) |
Sales and account teams |
Ties churn to deal and contact history |
Limited statistical modeling |
|
Purpose-built churn platforms |
Predictive scoring at scale |
Built-in survival and predictive models |
Higher cost, longer setup |
|
Spreadsheet models |
Small client books |
Fast to build, no new tools |
Breaks down past a few hundred accounts |
Pick based on account volume, not brand recognition. A firm managing 40 client accounts does not need the same stack as one managing 4,000.
Client Retention Strategies That Hold Up After the Data Is In
Data only matters if it changes what happens next. Once an account is flagged as at-risk, the response needs to be specific to the reason it was flagged, not a generic save call.
- Assign a stability lead to accounts with agent attrition above the account's own average, not just the company average.
- Shorten the escalation path so service issues reach a decision-maker within 24 hours, not at the next quarterly review.
- Share attrition and quality data with the client proactively before they ask, which builds trust instead of triggering suspicion.
- Revisit pricing and staffing models on accounts with thin margins, since underpriced accounts are the ones most likely to get short-staffed first.
Top-Rated Firms for Win-Loss and Churn Analysis
If churn analysis is not something your team has bandwidth to build in-house, third-party win-loss and churn analysis firms can run structured client interviews after a cancellation to identify the real reason behind it, separate from what the client says on the exit call.
The Bottom Line
Churn rate will analyze the work when it is specific, frequent and tied to the operational data that will actually predict the client behavior not just a quarterly summary number. Agent attrition, ticket trends and cohort retention curves tell the story weeks before the clients pick up the phone to cancel.
Build the habit of checking account-level risk monthly, not annually, and the exit calls become far less common.
Prime BPO helps outsourcing teams build the staffing stability and account monitoring that keeps churn low in the first place. If you want a second look at how your current retention data holds up, talk to Prime BPO about a free account health review, no pressure, just a clear picture of where you stand.
Get Free Quotes
Customized Options Await
FAQS
How to analyze churn rate?
You have to analyse the churn by comparing the number of customers with subscribers who leave during a specific time with the total customer at the beginning of that period. Also look at churn trends, reasons for the cancellations, customer segments and retention rates.
What does a 20% churn rate mean?
A 20% churn rate means that 20% of your customers or subscribers left during the measured time. .
What is the churn rate formula?
The basic churn rate formula is:
Churn Rate = (Customers Lost During the Period ÷ Customers at the Start of the Period) × 100
For example, if you started with 500 customers and lost 25, your churn rate would be 5%.
Is churn rate a KPI?
Yes, churn rate is an important KPI (Key Performance Indicator). It helps businesses measure customer retention and understand how many customers they are losing over a specific period. A lower churn rate generally indicates stronger customer retention.